TessEm7000 Performance Comparison
|
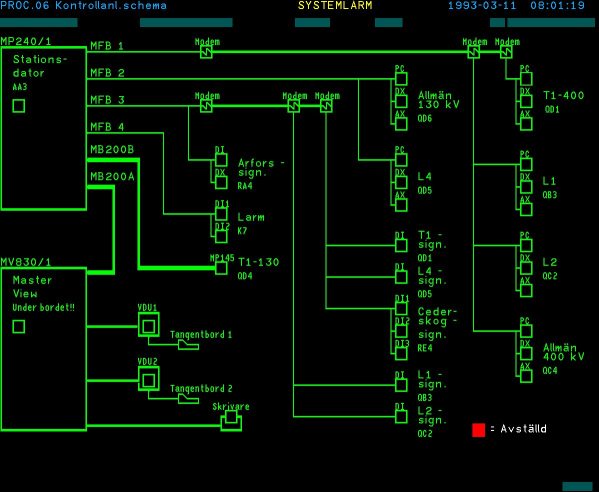
A typical power distribution control display, see below, containing 2132 screen objects and 8 background color rectangles was used to compare the performance of the TessEm7000 with an original TESSELATOR 7000. |
|
|
|
Typical power distribution control display |
| The display information was stored in Local Display Storage. Sending the following commands from a host computer to the display channel performed the test: CLEAR WORK AREA SCREEN (CF 48H) followed by LOCAL STORAGE LOAD (CF FBH). The command sequence was repeated 100 times sent in one communication message (ADLP10- and TOP-message). |
| Average display presentation time in ms |
| TessEm7000 | 22 (*) | 9 (**) |
| TESSELATOR 7810 | 275 (*) | - |
| (*) | Lines drawn using symbols. |
| (**) | Lines drawn using vectors. |
The TessEm7000, version 2.2.0, was running on a standard PC with the following data:
|
|
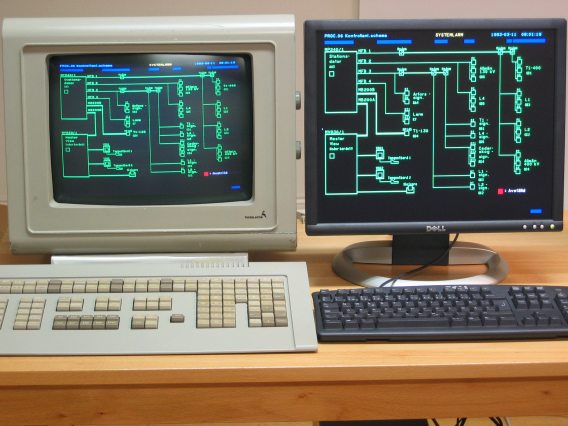
Check out the blistering performance of the TessEm7000 compared with TESSELATOR 7810 in a low resolution video! The video shows the performance test, described above, simultaneous run on the two types of system with the TESSELATOR 7810, to the left, and the TessEm7000 to the right. |
 |